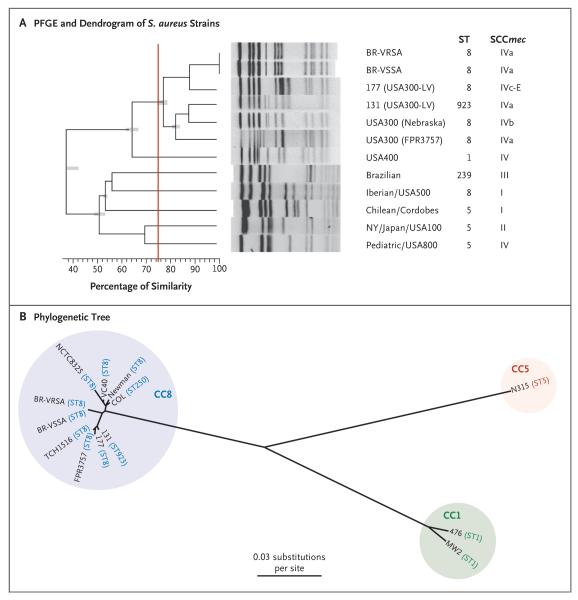
Figure 3. Phylogenetic Comparisons of BR-VRSA and BR-VSSA with Representatives of Other Methicillin-Resistant Staphylococcus aureus (MRSA) Clones.
Panel A shows a dendrogram of the pandemic MRSA clones, BR-VRSA and BR-VSSA, generated with PFGE and the use of GelCompar II software, version 6.5 (Applied Maths). Patterns were clustered by means of UPGMA (unweighted pair group method with arithmetic mean), with the use of the Dice similarity coefficient and an optimization of 0.50% and a tolerance of 1.0%. PFGE types, or clusters, were identified on the basis of a similarity of 75% or higher (indicated by the vertical red line). ST denotes sequence type. The phylogenetic tree shown in Panel B is based on whole-genome single-nucleotide polymorphisms (SNPs) and was generated with the use of the maximum-likelihood optimality criterion. Branch lengths are proportional to the number of evolutionary changes (substitutions per site). All nodes have 100% bootstrap support. Sequence types (STs) and clonal complexes (CCs) of the S. aureus strains are indicated.

