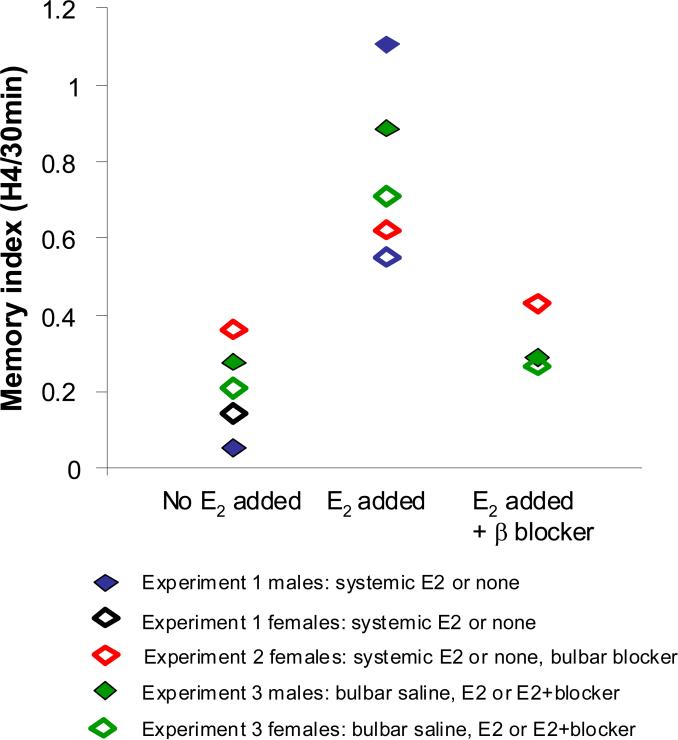
Figure 5. Summary of experimental results.
The graph shows the ratio between investigation during the last habituation trial and the 30 minute test trial. This ratio is an indicator for how well the odor is remembered after 30 minutes. The graph shows the average degree of odor memory for each treatment group at the 30 minute delay for mice with E2 (systemic or local), without E2, or with E2 and local blockers.

