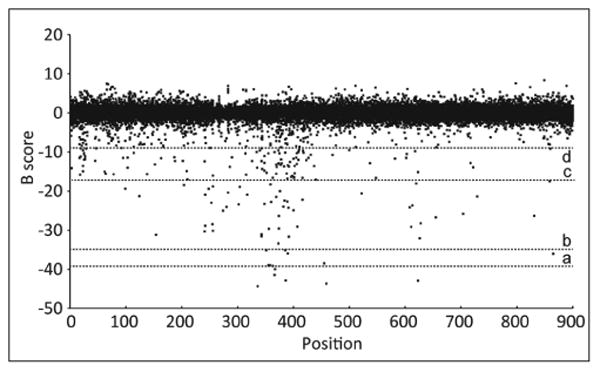
Figure 5.

Overview of the primary high-throughput screening (HTS) carried out at 60 μM. Data were stored in the database and normalized with the b-score algorithm. Different cutoffs represented by dotted lines were applied to identify hits. a: b-score = −39 (>90% of GCPII binding), b: b-score = −35 (>75% of GCPII binding), c: b-score = −17 (>50% of GCPII binding), d: b-score = −9 (>25% of GCPII binding). GCPII, glutamate carboxypeptidase II.
