
Fig.2.
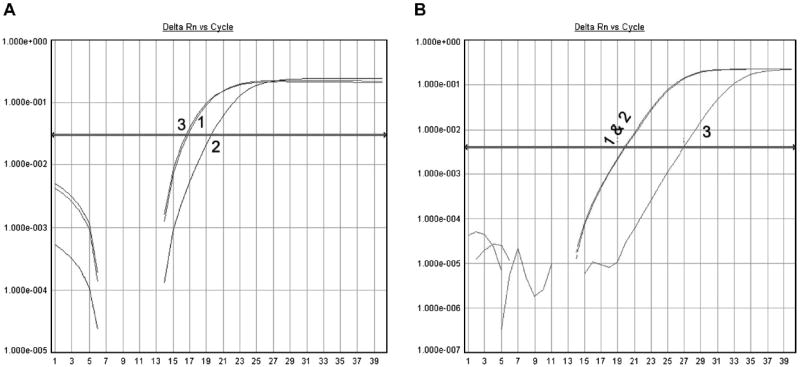
Measurement of binding affinity of miRNAs on TCF8 3′UTR via miRNA real-time PCR. In the two panels, 1 represents the cDNA from the original input miRNA, 2 represents the cDNA from the unbound miRNA, and 3 represents the cDNA from the released miRNA. The binding affinity is measured by comparing the Ct value of the released miRNA with that of the original input miRNA. (A) The Ct value of the released miR-200c is close to that of the original input miR-200c. It implies that the binding affinity of miR-200c on TCF8 3′UTR is nearly 100%. (B) The Ct value of the released miR-100 is 7 cycles greater than that of the original input miR-100. It implies the binding affinity of miR-100 on TCF8 3′UTR is low (<1%).