Fig.3.

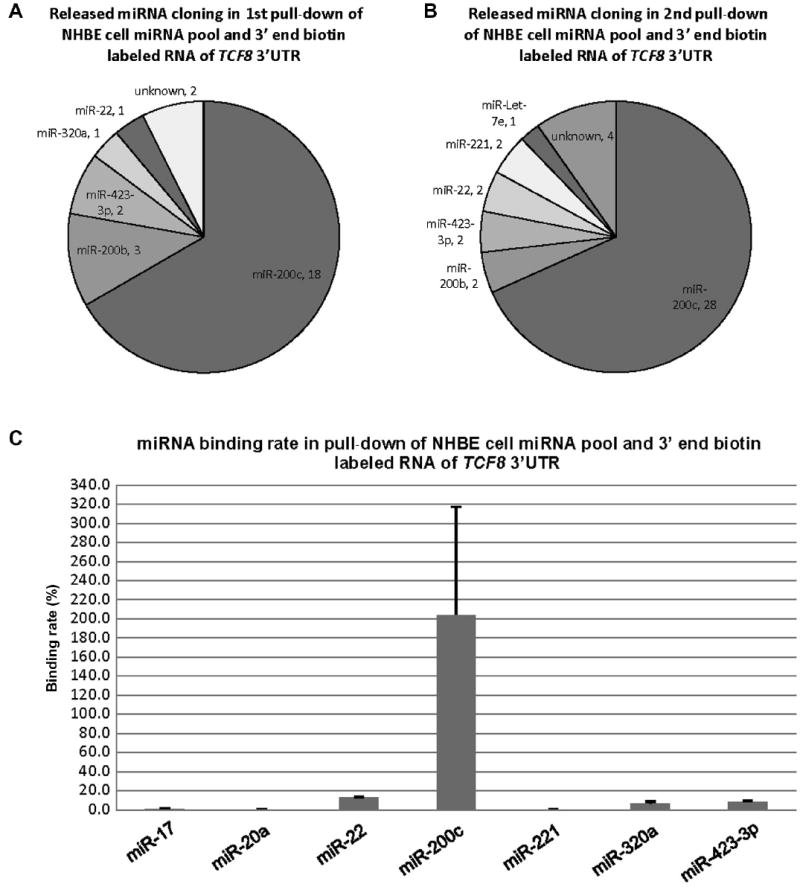
Cloning results and binding rates of the released miRNAs from the pull-down of NHBE cellular miRNAs and 3′ end biotin-labeled RNA of TCF8 3′UTR. (A) miRNA species and quantity of the released miRNAs from the first replicate pull-down. The results are from 27 random colonies. Each sector is labeled with miRNA name and quantity. miRNA quantity is presented by the sector area. Unknown means the sequences from the cloning could not be matched to the known miRNAs (Sanger miRNA database). (B) miRNA species and quantity of the released miRNAs from the second replicate pull-down. The results are from 41 random colonies. (C) Binding rates of 7 released miRNAs. miR-20a was used as a negative control based on the previous pull-down of the pool of synthetic miRNAs by full-length biotin-labeled RNA of TCF8 3′UTR. The binding rate of miR-20a was 0.2% in this end-labeled pull-down. miR-17 was cloned from the pull-down of the entire cellular miRNA pool and full-length biotin-labeled RNA of TCF8 3′UTR, and its binding rate was 1.0%, in this end-labeled pull-down. miR-200c showed complete binding/recovery. The possible reasons for binding affinity of more than 100% are outlined in the Discussion section. The binding rate data are from both biological duplicates and technical duplicates in each condition. Error bars represent standard deviations.
