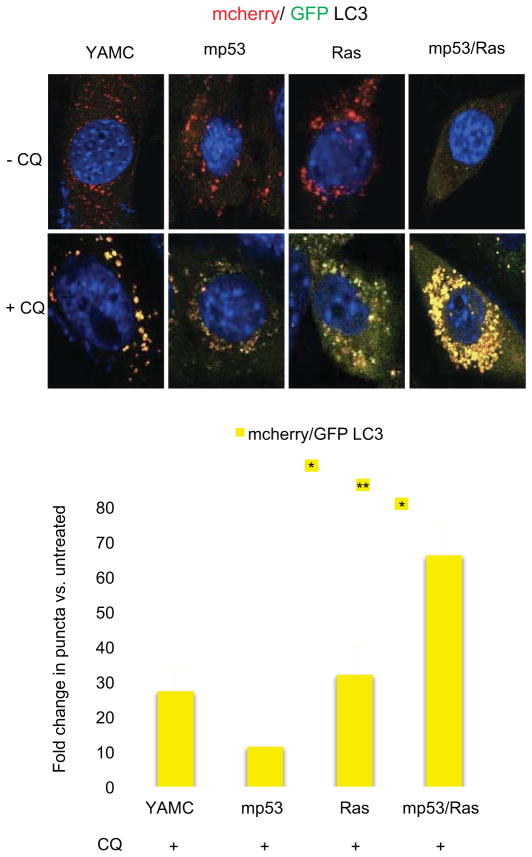
Figure 6. Synergistic induction of autophagic flux by mutant p53 and activated Ras.
YAMC, mp53, Ras and mp53/Ras cells expressing mCherry-EGFP-LC3 were exposed to 25μM chloroquine (CQ) for 24 hours or left untreated, fixed, and imaged using confocal microscopy. Representative images show the merge of red and green channels, with yellow representing signal colocalization. Autophagosomes (yellow) and autolysosomes (red) quantified using ImageJ. Fold-changes in punctae areas/cell are indicated (mean +/− SD; student’s T-test; **p<0.01; *p<0.05; n≥50 cells/line).

