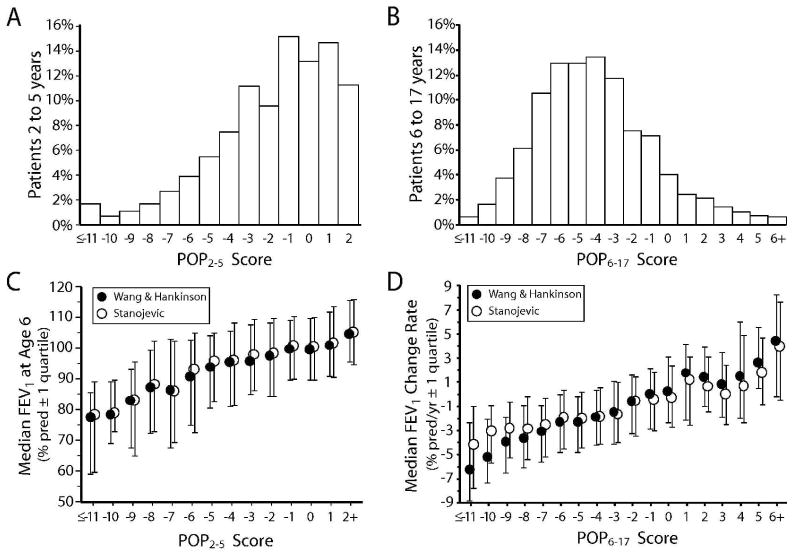
Figure 3. Distributions of POP scores and median outcomes by POP scores.
Panel A: distribution of POP2–5 scores for 3,458 patients in the validation group. Panel B: distribution of POP6–17 scores for 7,086 patients in the validation group. Panel C: median FEV1% predicted at age 6 years (FEV16yr) values calculated using the reference equations of Wang et al.19 and Hankinson et al.20 (closed circles) and Stanojevic et al.23 (open circles) for patients in Panel A by POP2–5 score. Bars indicate first and fourth quartile boundaries. Panel D: median annualized FEV1% predicted change (FEV1change) values calculated using the reference equations of Wang et al.19 and Hankinson et al.20 (closed circles) and Stanojevic et al.23 (open circles) for patients in Panel B by POP6–17 score. Bars indicate first and fourth quartile boundaries.

