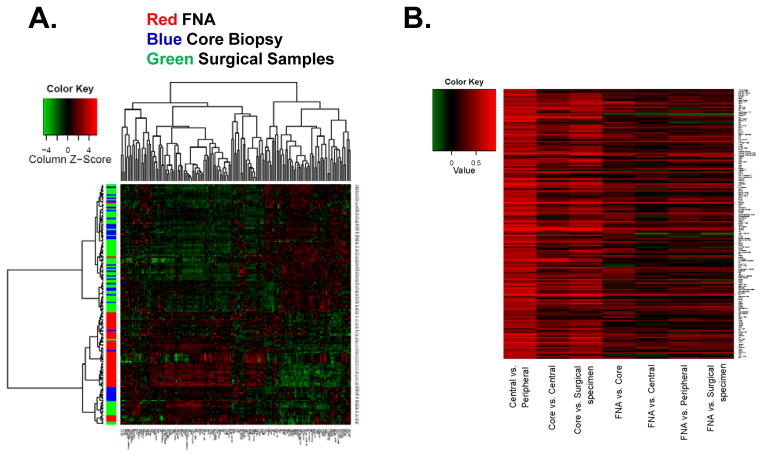
Figure 2.
RPPA on different biospecimens. A. Unsupervised hierarchical clustering of RPPA results on different biospecimen types. Each column represents a different protein or phosphoprotein and each row, a different sample. Red, FNA samples; blue, core needle biopsy; green, surgical samples. B. The correlation between different biospecimens for each biomarker depicted as a heatmap. Red, high positive correlation, green negative correlation.

