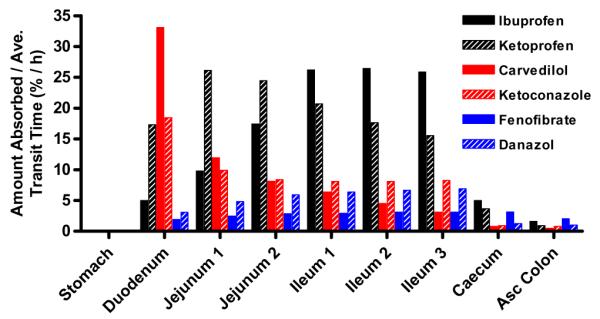
Fig. 3.

The absorption rates of BCS Class II drugs in each GI segment. Percentages of amount absorbed after oral administration of an IR dosage are divided by the average transit time and are plotted as a function of each GI segment. Black bars represent BCS Class II weak acids, Red bars represent BCS class weak bases and blue bars represent BCS class neutrals. (For interpretation of the references to color in this figure legend, the reader is referred to the web version of this article.)
