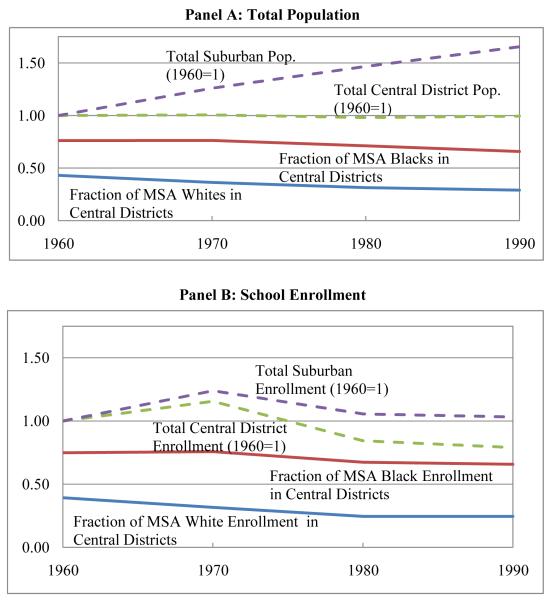
Figure 1. Trends in Metropolitan Area Residential Location Patterns by Race.
Note: The top two lines in Panel A show the evolution of aggregate suburban and central district white plus black populations over time in our sample of 92 MSAs. We index year 1960 values to 1. The bottom two lines show the evolution of the fraction of the white and black populations living in central districts. Panel B presents analogous results for the population enrolled in school (K-12).

