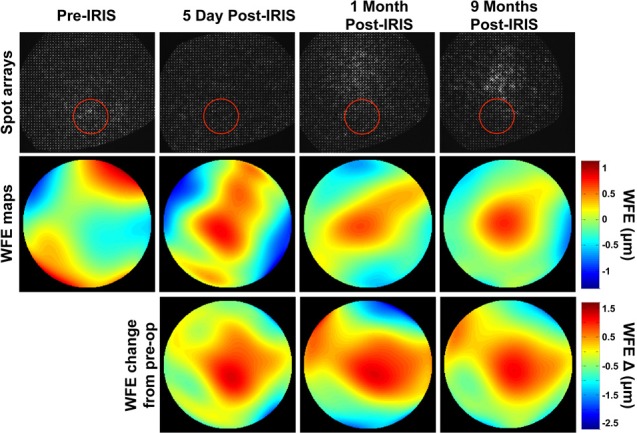
Figure 3.

Representative wavefront spot arrays, raw wavefront error (WFE) maps, and wavefront error change maps relative to the pre-IRIS state from Cat 1 OS. Images of spot array patterns collected pre-IRIS as well as 5 days, 1 month, and 9 months post-IRIS in the same eye. Each reconstructed WFE map below the spot array patterns is the average of at least 14 wavefronts from the same time-point over a 3-mm-diameter analysis region centered on the nominal location of the IRIS pattern (red circles in spot array patterns above each WFE map). The change from pre-IRIS WFE maps are generated by subtracting the average pre-IRIS wavefront from the average wavefront at each time-point of interest post-IRIS. The inscribed Blue-IRIS pattern contributes the characteristic sphero-cylindrical shape present in all of the change from pre-IRIS wavefront maps, and which disappears whenever the analysis aperture is moved off the IRIS pattern area.
