
Figure 4.
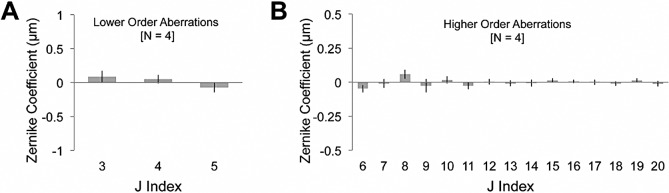
Magnitude of baseline (pre-IRIS) Zernike terms. (A) Plots of the magnitude of lower-order (j = 3–5) Zernike coefficients averaged across all four eyes in the study. (B) Plots of the magnitude of higher-order (j = 6–20) Zernike coefficients averaged across all four eyes in the study. In all cases, the data were collected over a 3-mm-diameter, circular region of the cat cornea that approximates the region over which the IRIS pattern would be inscribed. Error bars represent SEM.