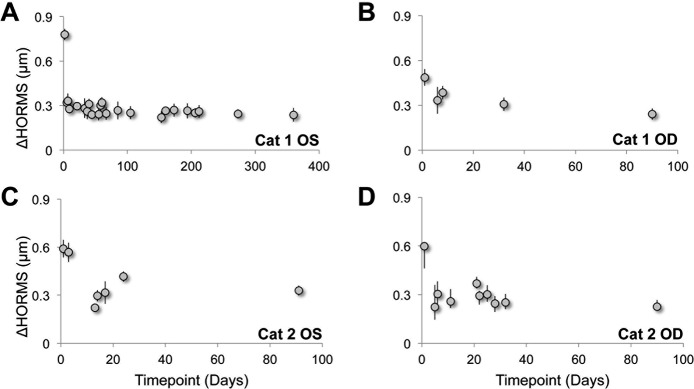
Figure 7.

The effect of Blue-IRIS on HORMS expressed as change from baseline. Plots of HORMS (j = 6–20) in microns induced by Blue-IRIS as a function of days post-IRIS over a 3-mm-diameter measurement aperture centered on the approximately 2.5 × 2.5 mm2 Blue-IRIS pattern. The HORMS was calculated from difference from pre-IRIS data. (A) The induced HORMS in Cat 1 OS. (B) The induced HORMS in Cat 1 OD. (C) The induced HORMS in Cat 2 OS. (D) The induced HORMS in Cat 2 OD. After some initial fluctuation within the first 1 to 3 days post-IRIS, HORMS tended to converge toward 0.3 μm in all four eyes. Error bars represent SDs.
