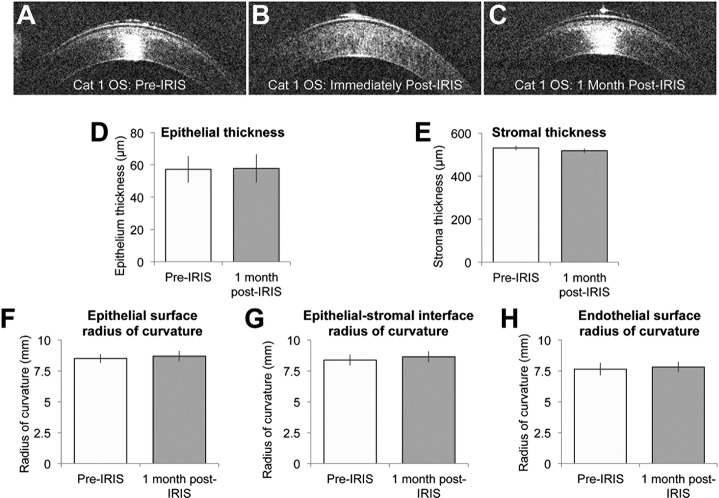
Figure 8.
Impact of Blue-IRIS on corneal thickness and curvature. (A–C) Optical coherence tomography images of Cat 1 OS at various time-points pre- and post-IRIS. (D–E) The mean pre- and 1 month post-IRIS epithelial and stromal thicknesses, respectively, across all four Blue-IRIS–treated eyes. Note the lack of significant change in either measure post-IRIS. (F–H) The radii of curvatures of the interfaces between various corneal layers measured pre-IRIS and 1 month post-IRIS. These data also have been averaged across all four eyes in the present study. Note the lack of significant change in any of the curvatures measured. The error bars represent the SEM.

