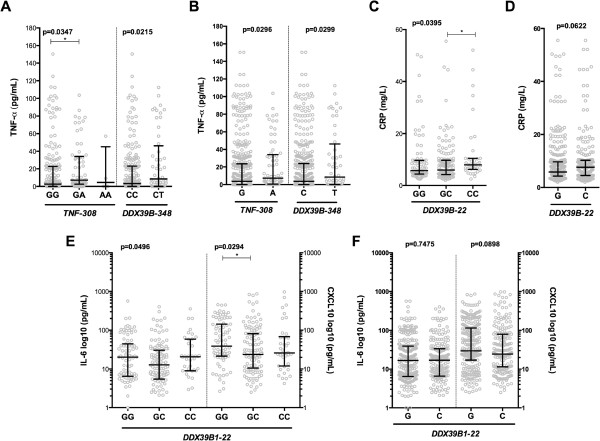
Figure 1.

Influence of genetic alterations on levels of inflammatory mediators. Each symbol represents a single patient, and the lines represent medians and interquartile range. (A) Levels of TNF according to genotypes of TNF-308G > A and DDX39B-348C > T polymorphisms. Analysis excluded TT (DDX39B-348C > T), because only 1 uninfected participant had this genotype. (B) Levels of TNF according to alleles of TNF-308G > A and DDX39B-348C > T polymorphisms. (C) CRP plasma levels according to different DDX39B-22C > G genotypes. (D) CRP plasma levels according to different DDX39B-22C > G alleles. (E) IL-6 and CXCL10 levels according to DDX39B-22C > G genotypes. (F) IL-6 and CXCL10 levels according to DDX39B-22C > G alleles. The data were compared using the Mann–Whitney test (comparisons between two groups), the Kruskal-Wallis test with Dunn multiple comparisons or linear trend analysis (comparisons between more than 2 groups). P values are shown in each panel.
