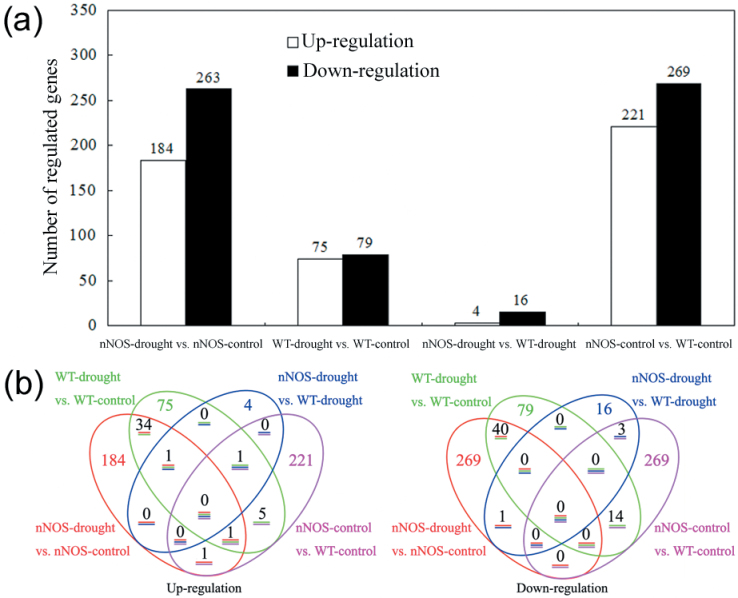
Fig. 3.
Number of genes differentially expressed in WT versus nNOS transgenic plants under control and drought conditions. (a) Total number of affected genes in WT and nNOS transgenic plants under control and drought conditions. (b) Venn diagram showing the number of overlapping genes that are differentially expressed between WT and nNOS transgenic plants under control and drought conditions. (This figure is available in colour at JXB online.)

