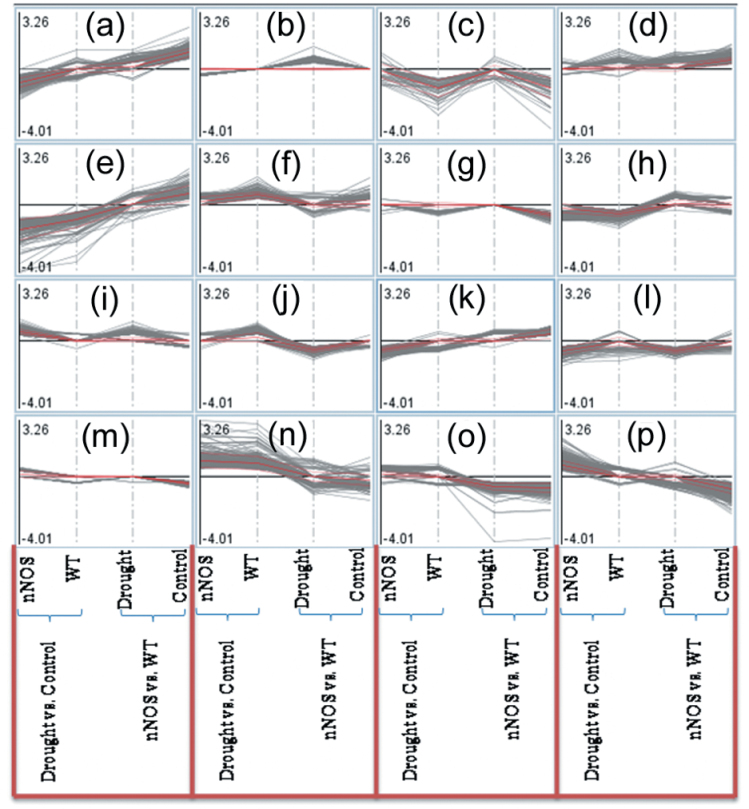
Fig. 4.
Cluster analysis of microarray data using MapMan software. All microarray data were divided into 16 clusters that were labelled from (a) to (p). Detailed information for each cluster is provided in Supplementary Table S3 at JXB online. (This figure is available in colour at JXB online.)

