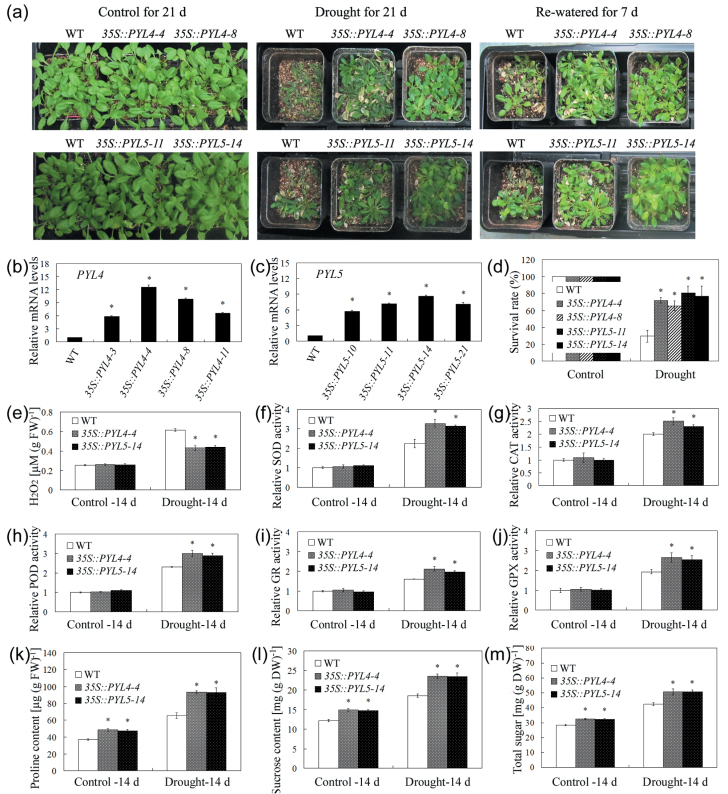
Fig. 6.
Enhanced drought resistance of plants overexpressing AtPYL4 and AtPYL5. (a) Two-week-old plants were subjected to drought stress conditions (or to well-watered, control conditions) for 21 d before they were re-watered; the plants were photographed 7 d after watering was resumed. (b and c) Gene expression of AtPYL4- (b) and AtPYL5- (c) overexpressing plants. The relative mRNA level of WT plants was set at 1.0. (d) Survival of AtPYL4- and AtPYL5-overexpressing plants under control and drought stress conditions. (e–m) H2O2 content (e), SOD activity (f), CAT activity (g), POD activity (h), GR activity (i) GPX activity (j), proline content (k), sucrose content (l), and soluble sugar content (m) of WT, AtPYL4, and AtPYL5 transgenic plants during control and drought stress conditions. The relative activities were quantified as fold change relative to the WT under control conditions for 14 d. Values are means ±SEs (n=3). Asterisks indicate significant differences between WT and nNOS transgenic plants (P<0.05). (This figure is available in colour at JXB online.)

