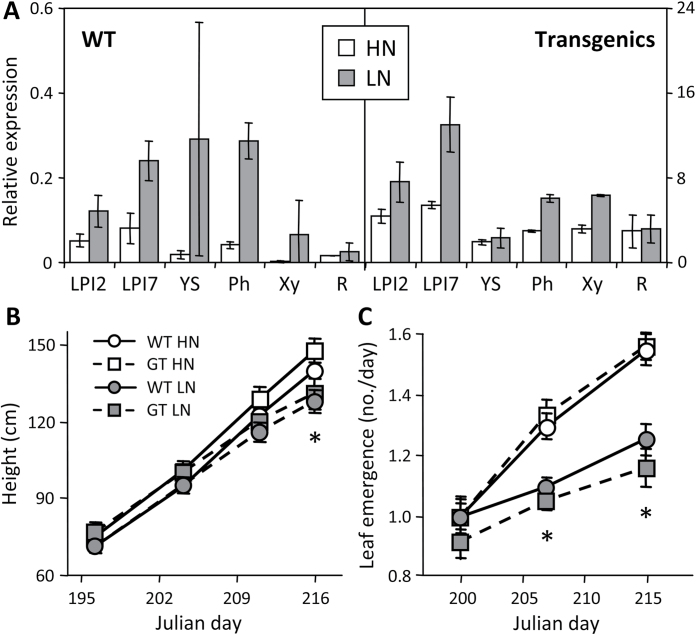
Fig. 4.
Molecular and growth characterization of transgenic Populus. (A) Relative transcript abundance of the GT1-315/316 cluster in WT and transgenic plants under N-replete (HN) or N-limited (LN) treatments. Leaves (LPI2, LPI7), young stem (YS), phloem (Ph), xylem (Xy), and coarse roots (R) were analysed. Values are mean and SD of three biological replicates from line D. (B and C) Height growth (B) and leaf emergence (C) rates of WT and transgenic (GT) plants. Values are mean and SE of 15 biological replicates, pooled from lines A, D, and H. Asterisks indicate significant LN treatment effects.

