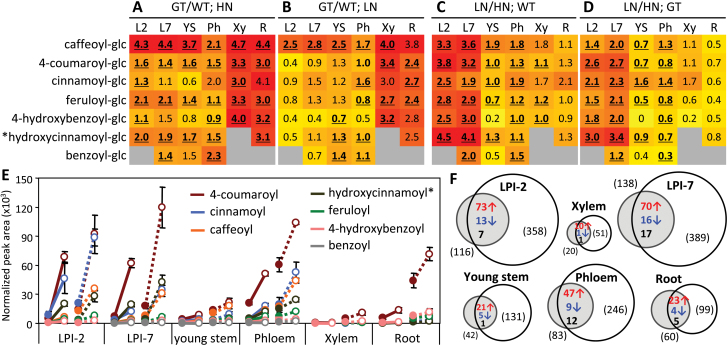
Fig. 5.
Effects of PfaGT1-316 overexpression and N limitation on hydroxycinnamate glucose ester accumulation. (A and B) Transgenic effects (GT/WT) under high-N (A) or low-N (B) conditions. (C and D) N stress response (LN/HN) in WT (C) and transgenic (D) plants. Shown are log2-transformed ratios in heatmaps. Values in bold-face with underline denote statistical significance (Q <0.05). Grey indicates below detection. (E) The same data plotted by normalized peak areas to illustrate the relative abundance of the glucose esters (solid symbols, HN; open symbols, LN; solid lines, WT; dashed lines, transgenic). Values are mean and SD of three biological replicates. The asterisk indicates an unknown hydroxycinnamoyl-glucose ester with a m/z of 325.0921. (F) Venn diagrams showing overlap of significantly changed metabolites (P<0.05) due to transgenic (GT/WT under HN, grey circles) or N (LN/HN in WT, white circles) manipulation. The numbers of metabolites with increased (red) or decreased abundance (blue), or inconsistent changes (black) are shown in the overlap, with the total number of significantly changed metabolites noted in parentheses.

