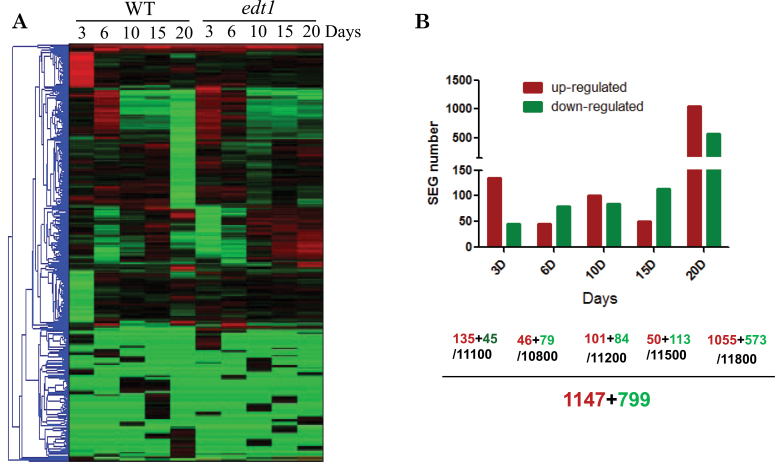
Fig. 1.
Microarray analysis of edt1 roots. RNA samples isolated from 3-, 6-, 10-, 15-, and 20-d-old roots of edt1 and wild-type plants were analysed by microarray. (A) Overview of gene clusters. (B) SEG numbers at different growth stages. Upregulated and downregulated SEG numbers are indicated, together with the total number of genes identified at each specific stage. (This figure is available in colour at JXB online.)

