Fig. 1.
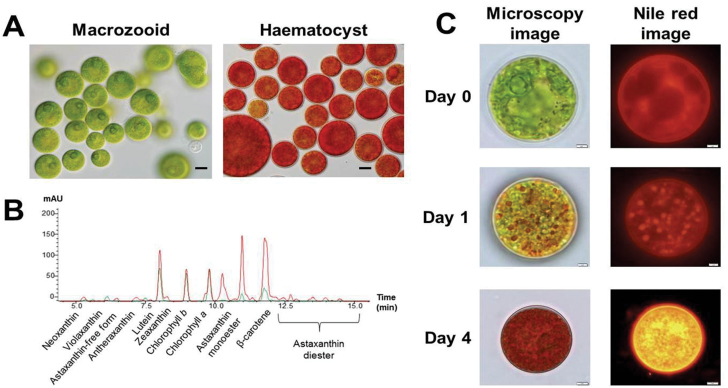
Haematococcus pluvialis cell. (A) Light microscopy image of H. pluvialis. Left panel, macrozooid cells (control); right panel, haematocyst cells (high light stressed for 2 d). Scale bar=10 μm. (B) HPLC pigment analysis of H. pluvialis cells. Green and red lines indicate the macrozooid cells and high light-stressed haematocysts, respectively. (C) Nile red-stained images of H. pluvialis cells before and after transferring them to high light stress conditions. Scale bar=2 μm.

