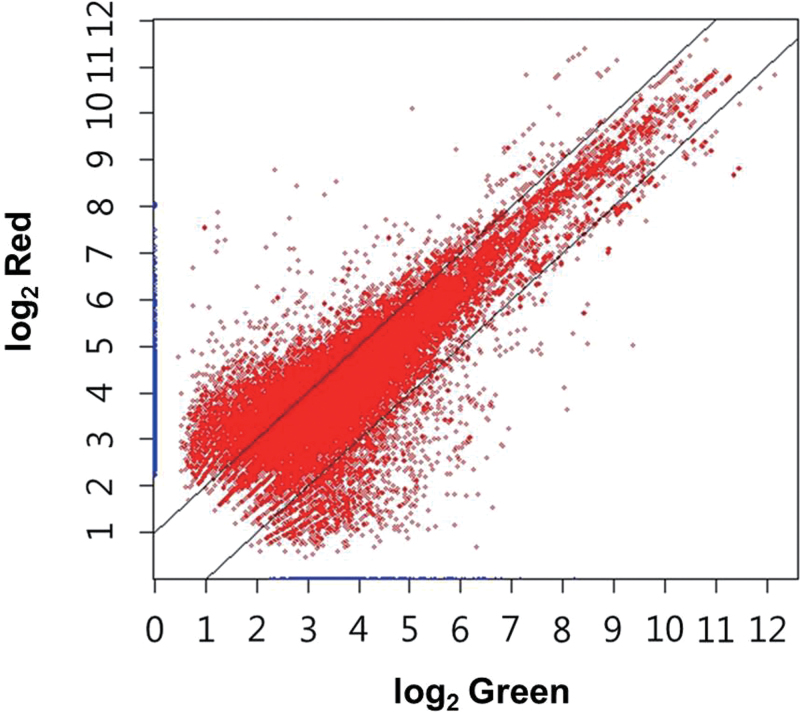
Fig. 6.
Scatter plot of normalized abundances of each cell type [green (macrozooid) and red (haematocyst)]. Differential expression >2-fold was detected in as many as 38.1% of assemblages between macrozooid and haematocyst cells. Approximately 30.6% of the transcripts were expressed more abundantly in haematocyst cells than in macrozooid cells. (This figure is available in colour at JXB online.)

