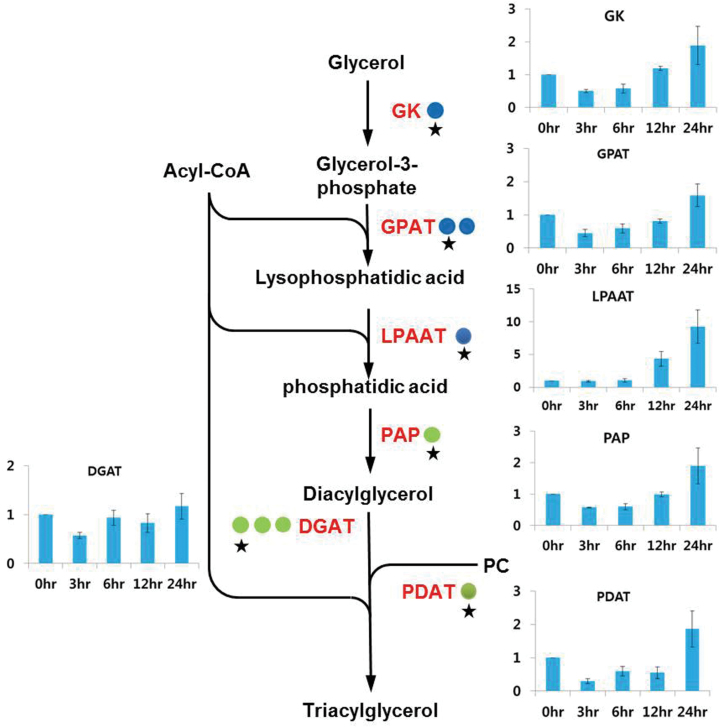
Fig. 9.
Differential expression of genes involved in the triacylglycerol biosynthesis pathway. Coloured circles indicate the normalized read number ratio of red (haematocyst) per green (macrozooid) cells and each circle represents an independent isogroup (gene). The star designates the primer-designed gene for RT–qPCR. The bar graph indicates the expression pattern of each star-marked gene in RT–qPCR analysis. Values in the bar graphs are the mean ±SD of six different measurements. GK, glycerol kinase; GPAT, glycerol-3-phosphate acyltransferase; LPAAT, lysophosphatidic acid acyltransferase; PAP, phosphatidic acid phosphatase; DGAT, diacylglycerol acyltransferase; PDAT, phospholipid:diacylglycerol transferase.

