Figure 1.

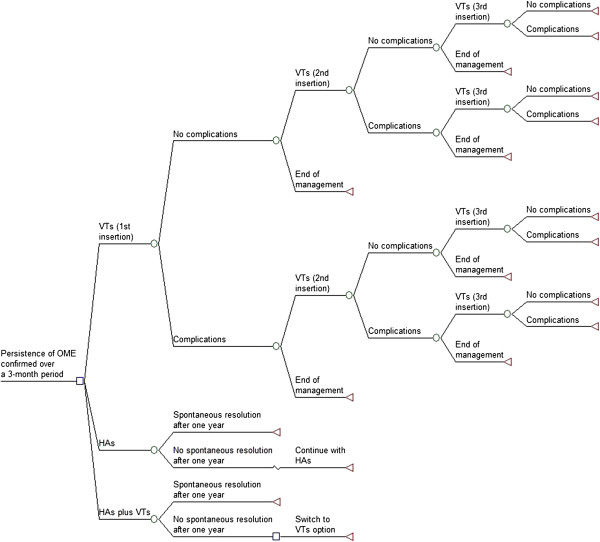
The decision-tree diagram. Figure footnote: The pathways of the HAs plus VTs strategy resemble that of the first 12 months of the HAs strategy and then of the first 12 months of the VTs strategy.

The decision-tree diagram. Figure footnote: The pathways of the HAs plus VTs strategy resemble that of the first 12 months of the HAs strategy and then of the first 12 months of the VTs strategy.