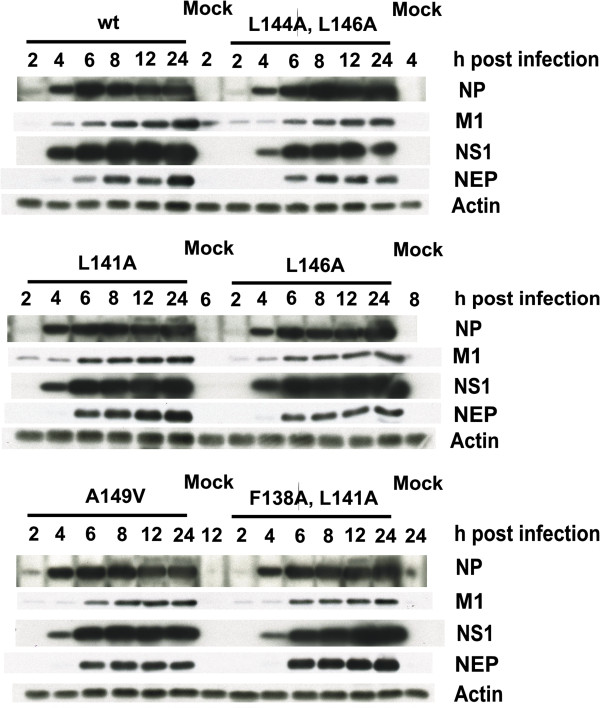
Figure 5.

Expression kinetics of viral proteins during infection. A549 cells were infected at MOI 1 with A/Udorn/72 wild type and mutant viruses and cell lysates were collected at the indicated time points. The amounts of NS1, NP, NEP, M1 and actin in the lysates were visualized by immunoblotting (10 μg total protein/lane). Data shown is representative of three independent experiments.
