
Figure 2.
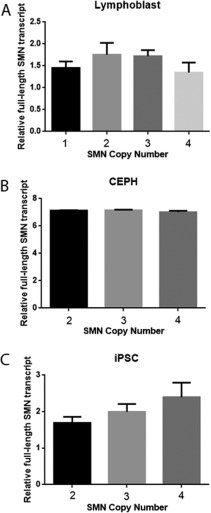
Total SMN mRNA levels in different cells. (A) Coriell lymphoblasts (n = 3 with SMN1 copy number 1, 7 with copy number 2, 11 with copy number 3, and 3 with copy number 4). (B) Centre d'Etude du Polymorphisme Humain (CEPH) lymphoblasts (n = 33 with SMN1 copy number 2, 3 with copy number 3, and 3 with copy number 4). (C) Induced pluripotent stem cells (iPSC; n = 8 with SMN1 copy number 2, 4 with copy number 3, and 3 with copy number 4). Mean and standard error of the mean are shown.