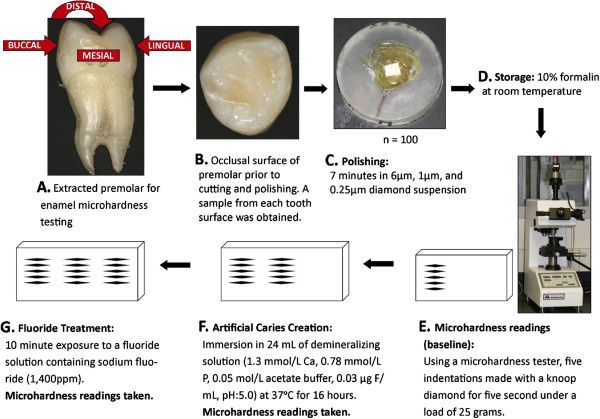
Figure 3.

Enamel microhardness study design. Image above A depicts the five tooth surfaces upon which enamel microhardness was tested. Image above B is a close-up of the occlusal surface. Image above C shows the appearance of an enamel specimen ready to be tested. Image below D shows the testing unit. Microhardness was tested at baseline, after artificial caries creation, and after exposure to a fluoridated solution (panels above E, F, and G. are schematic representations of the assessments).
