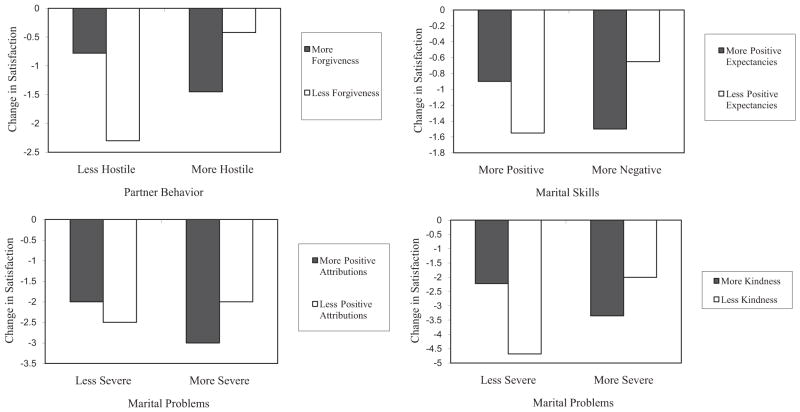
Figure 1. Psychological Processes in Context.
Note. Each plot depicts the predicted means for people one standard deviation above and below the mean on each variable involved in the interaction. Data depicted in the upper left plot were drawn from a broader study of 72 newlywed couples from Northern Ohio assessed from 2003 through 2006. Data depicted in the upper right plot were drawn from a broader study of 82 newlywed couples from Northern Florida assessed from 1998 through 2002. Data depicted in the bottom left plot were drawn from the same study of 82 couples depicted in the upper right and a broader study of 169 newlywed couples from Northern Florida assessed from 2001 through 2005. Data depicted in the bottom right plot were drawn from a broader study of 135 newlywed couples from Eastern Tennessee assessed from 2006 through 2008.

