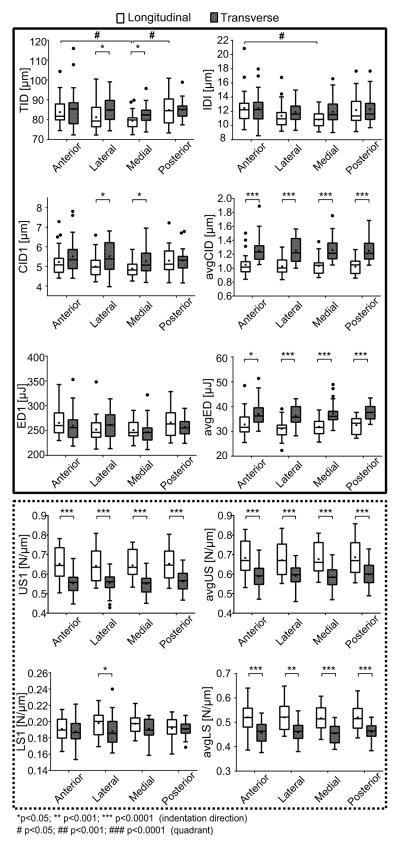
Figure 5.
Box plot graphs of RPI parameters per quadrant (anterior (A), medial (M), lateral (L), posterior (P)) and probing direction (transverse (t), longitudinal (l)). The solid and dotted frames gather the parameters related to the indentation depth and tissue stiffness, respectively. In post hoc analyses of RPI parameters, the family of null hypothesis tests only involved comparisons in which Quadrant or Direction was significant in the general linear model. Significant differences are indicated with a horizontal bar.

