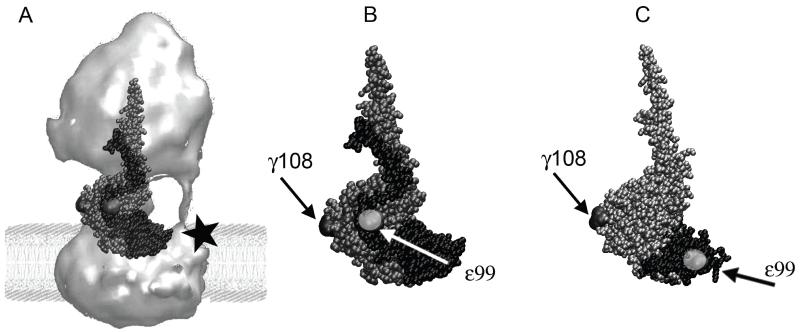
Figure 1.
(A) Structure of E. coli F Fo 1-ATP synthase (surface rendering from electron micrographs[32]) in a model lipid bilayer. Overlaid here in ball representation are the subunits that comprise the central rotary stalk: γ (grey) and ε (black) of the recent E. coli F X-ray structure[29] 1. Subunit a with a C-terminal cysteine mutation (black star) can be labeled for future 3-color FRET experiments. (B) Subunits γ (in grey) and ε (in black, in the ‘up’ configuration [29]), showing the positions of two cysteine mutations γ108 and ε99 (highlighted in light grey) for single-molecule FRET. (C) Partial structure of γ (in silver) and ε (in black) from F1 with ε’s C-terminal helices in the ‘down’-configuration[33]. Compared to (B), note the distinct distance between cysteines γ108 and ε99 for single-molecule FRET.

