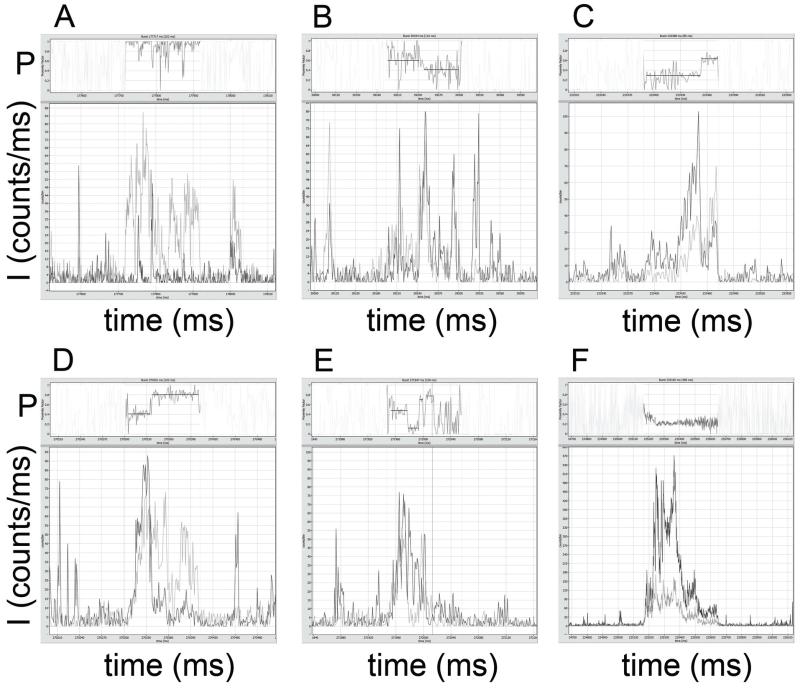
Figure 4.
Photon bursts of FRET-labeled FoF1-ATP synthases in the absence of nucleotides. Atto488 intensities are shown in dark grey, Atto647N intensities in light grey. Intensities are given in counts per ms. Corresponding proximity factor P traces within the marked bursts are found in the upper part of the images, with mean intensity-weighted P values as black lines (see text for photon burst details).

