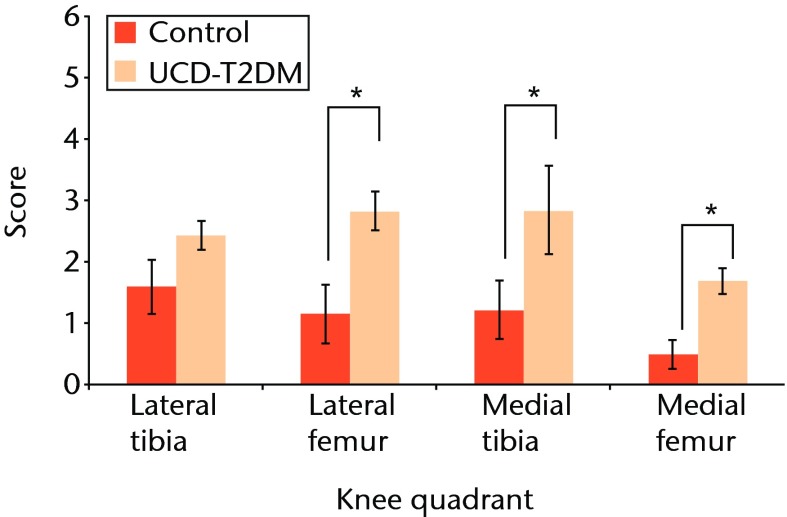
Fig. 1.
Graph comparing osteoarthritis scores between the control and the UCD-T2DM rat knees. The scoring scale used is modified from Pritzker et al25 “*” denotes statistically significant differences of p < 0.05. The UCD-T2DM rat had a significantly higher, thus worse, osteo-arthritis score at the lateral femur (p = 0.013), medial tibia (p = 0.003), and medial femur (p = 0.034) (Wilcoxon Test).

