
Fig. 7.
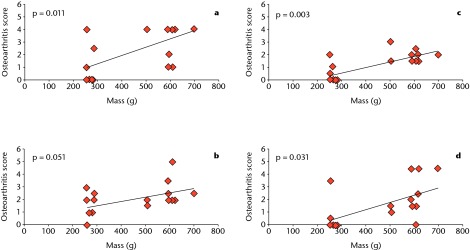
Graphs showing the correlation between osteoarthritis score and mass at different regions of the knee: a) lateral femur, b) lateral tibia, c) medial femur, and d) medial tibia. There is significant correlation between mass and histological score at the lateral femur (p = 0.011), medial femur (p = 0.003), and medial tibia (p = 0.031). The lateral tibia is not significant, but can still be considered a strong correlation (p = 0.051) (one-way ANOVA).