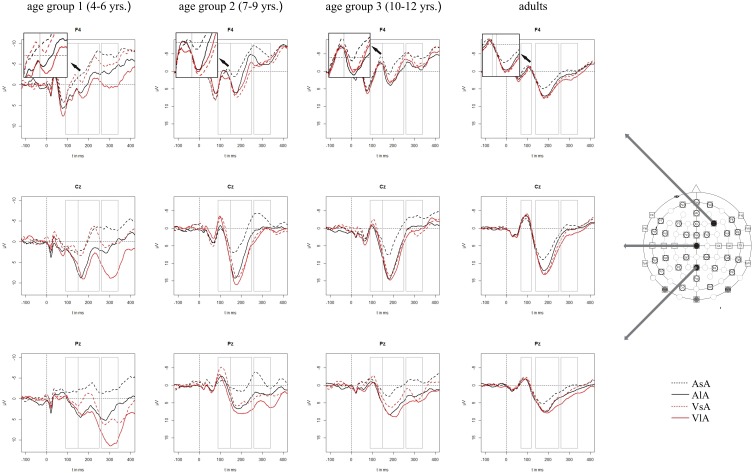
Figure 3.
Grand averaged ERPs to auditory stimuli in the unimodal (black line) vs. crossmodal (red line) condition and after short (dashed line) vs. long (solid line) interstimulus intervals. ERPs are demonstrated at a subset of representative electrodes and for the four different age groups. Abbreviations: [asa]: e.g., ERP to an auditory stimulus preceded by an auditory stimulus with a short ISI; a, auditory; v, visual; s, short ISI; l, long ISI. Time windows used for the statistical analyses are marked in gray. Negativity is plotted upwards.

