
Figure 1.
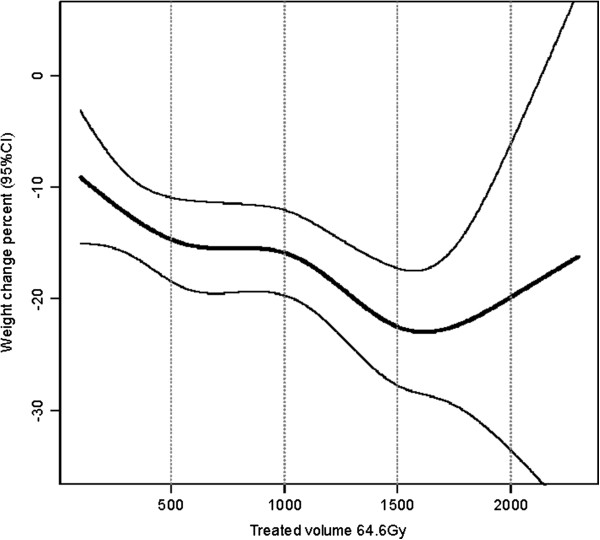
Nonlinear correlation between treated volume (TV64.6 Gy) and weight change. Regression model based on cubic splines for weight change in percent (95% CI) from the start of RT up to 5 months after RT with TV64.6 Gy and controlling for clinical stage and tube feeding at the start of RT (n = 228).