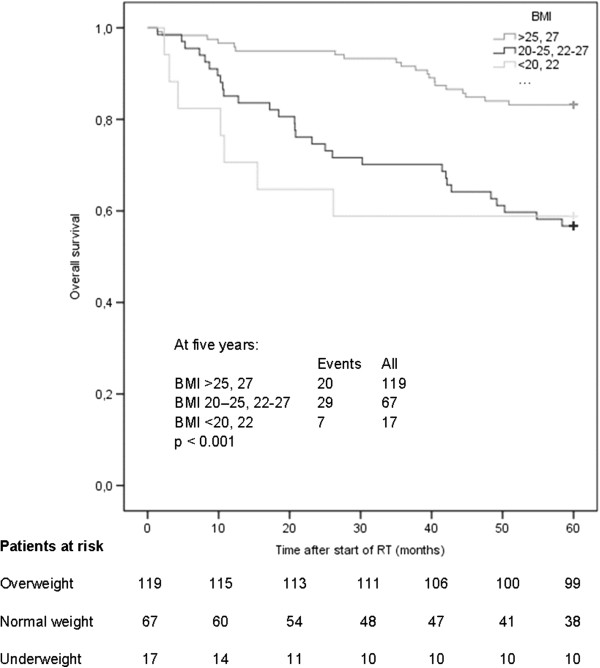
Figure 3.

Overall survival by body mass index (BMI) category. Kaplan–Meier plot of overall survival by BMI category at the start of RT (n = 203). The following cut-off values were used in the analyses: underweight BMI < 20 kg/m2 (or BMI < 22 kg/m2 if ≥70 years of age), normal weight BMI 20–25 kg/m2 (or BMI 22–27 kg/m2 if ≥70 years of age), and overweight/obesity BMI >25 kg/m2 (or BMI >27 kg/m2 if ≥70 years of age).
