Figure 2.

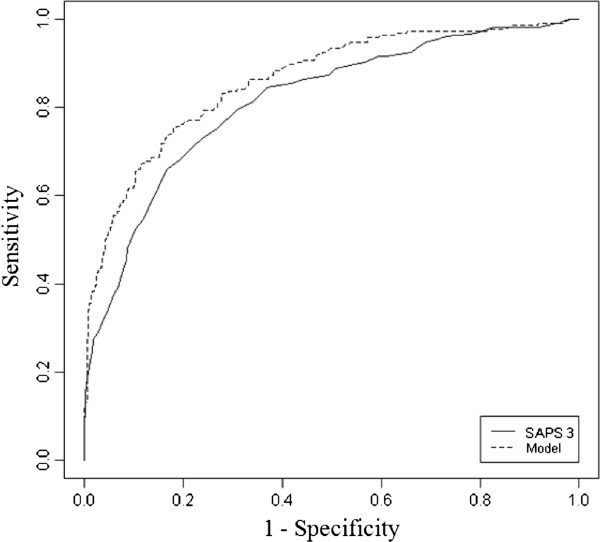
ROC curve for SAPS 3 and created model on the studied population. AUC for SAPS 3 = 0.81 (95% CI: 0.78-0.84). AUC for model = 0.86 (95% CI: 0.83-0.89). Curves are statistically different (DeLong’s test p < 0.001).

ROC curve for SAPS 3 and created model on the studied population. AUC for SAPS 3 = 0.81 (95% CI: 0.78-0.84). AUC for model = 0.86 (95% CI: 0.83-0.89). Curves are statistically different (DeLong’s test p < 0.001).