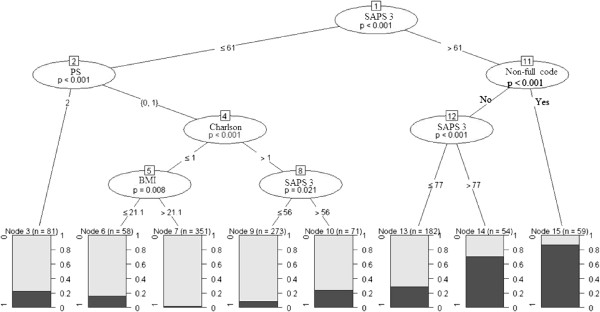
Figure 4.

Conditional inference tree using recursive partitioning results for hospital mortality. Dark grey bars mark percentage of patients that died during hospital stay. p values for each node are shown inside the ellipsis.

Conditional inference tree using recursive partitioning results for hospital mortality. Dark grey bars mark percentage of patients that died during hospital stay. p values for each node are shown inside the ellipsis.