Figure 3.

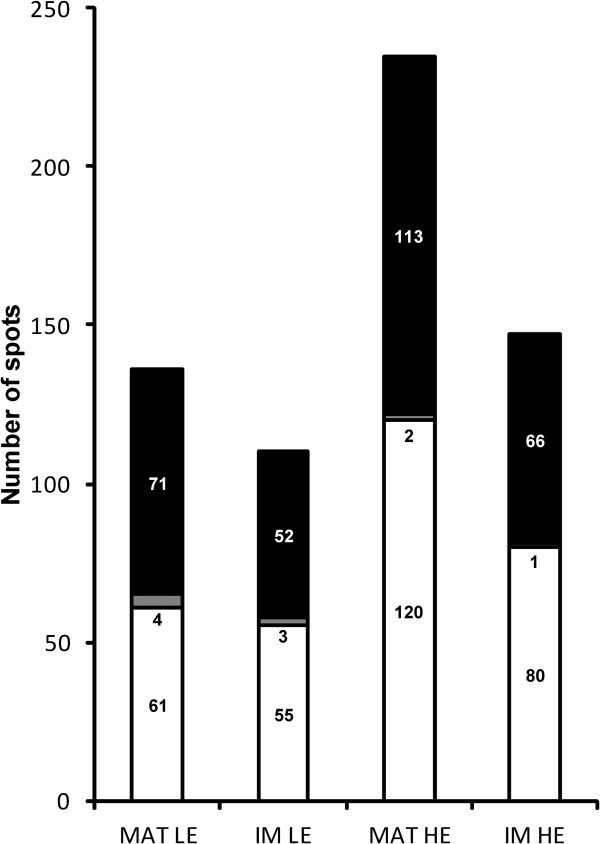
Histogram classifying PSOI according to the direction of their re-normalized expression variation. White, down-regulation; Black, up-regulation; Grey, absence of regulation. MAT, matrix; IM, inner membrane.

Histogram classifying PSOI according to the direction of their re-normalized expression variation. White, down-regulation; Black, up-regulation; Grey, absence of regulation. MAT, matrix; IM, inner membrane.