
Figure 5.
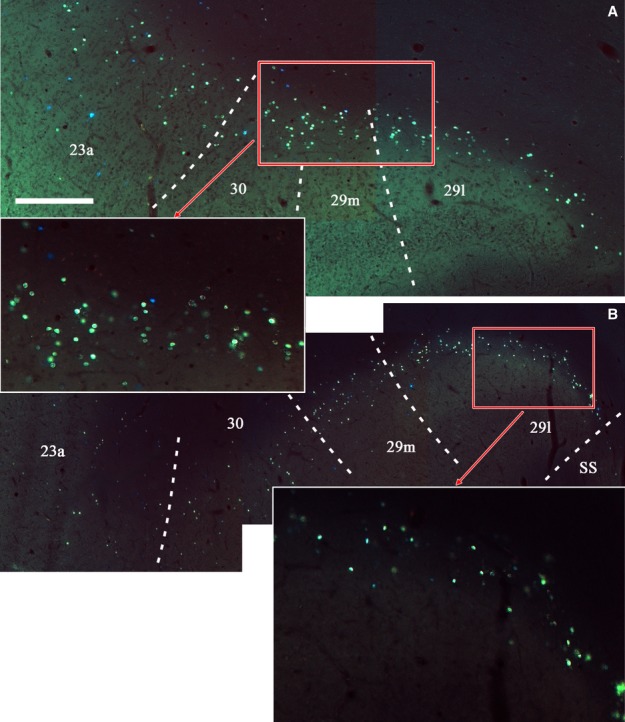
Photomicrographs of the two retrosplenial areas outlined in Fig.6 (A and B). The data, which are from Case BRh6, show the location and density of fluorescently labelled cells (DY) ipsilateral to an injection in the right laterodorsal thalamic nucleus. The two insets show specific subregions at a higher magnification. While the overwhelming majority of cells are DY (greenish yellow in appearance), there is a scattering of FB (blue) cells, especially in area 23a. These cells arise from the injections into the medial dorsal nucleus in the same hemisphere. Scale bar, 500 μm.