. 2014 Mar 20;103(5):488–493. doi: 10.1111/apa.12567
© 2014 The Authors. Acta Pædiatrica published by John Wiley & Sons Ltd on behalf of Foundation Acta Pædiatrica.
This is an open access article under the terms of the Creative Commons Attribution‐NonCommercial‐NoDerivs License, which permits use and distribution in any medium, provided the original work is properly cited, the use is non‐commercial and no modifications or adaptations are made.
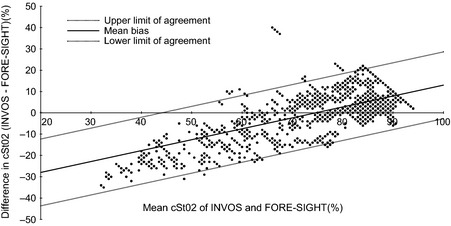
Figure 3.

Bland–Altman plot (mean, limits of agreement).
