Figure 1.

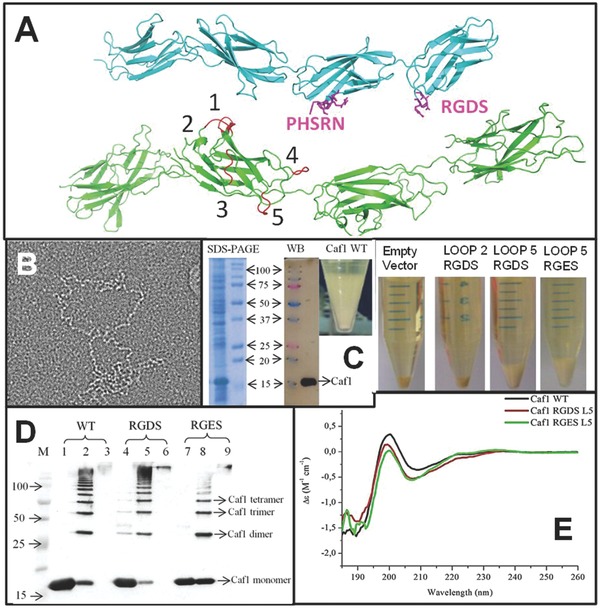
Expression of engineered Caf1. A) Upper molecule in cyan; Fibronectin Type III domain (PDB File 1FNF17 with sites of known cell adhesion motifs (RGDS and the accessory site PHSRN) highlighted in magenta. Lower molecule in green; Caf1 model based upon X‐ray and EM structures10 with RGDS insertion sites (loops) numbered. B) Linear, bead on a string, structure of Caf1 revealed by negative stain transmission electron microscopy. Box is 400 nm across. C) Expression of Caf1 showing pelleted cells and Caf1 rich flocculent layer. SDS‐PAGE Coomassie blue stained gel with heat treated flocculent layer sample (left) and M, molecular weight markers (molecular mass x 103 kDa arrowed) (right). WB‐Western blot using anti‐Caf1 antibodies. Pelleted cells showing lack of flocculent layer in empty vector and Loop2 RGDS samples whilst a clear flocculent layer is present in the Loop 5 mutant tube. D) Analysis of purified Caf1 polymers by western blotting using a mouse monoclonal anti‐Caf1 antibody. WT (lanes 1–3), Loop5 RGDS (lanes 4–6) and Loop5 RGES (lanes 7–9). Lanes 1, 4, 7 heated at 95 °C for 5 min showing only monomeric Caf1. Lanes 2, 5, 8 heated at 95 °C for 45 s showing a ladder of Caf1 multimers. Lanes 3, 6, 9 unheated showing only high MW polymers. E) Far UV‐CD spectrum of WT, Loop5 RGDS and Loop5 RGES Caf1 polymers. Each curve represents the average of 10 accumulated spectra measured at a concentration of 0.5 mg mL−1 Caf1 (0.05 cm path length cell). The sample contained 50 mM sodium phosphate, pH 7.2. Each spectrum was corrected by subtraction of a comparable blank. The abscissa is in units Δε (M−1 cm−1) where M is the molar concentration of amino acid residues.
