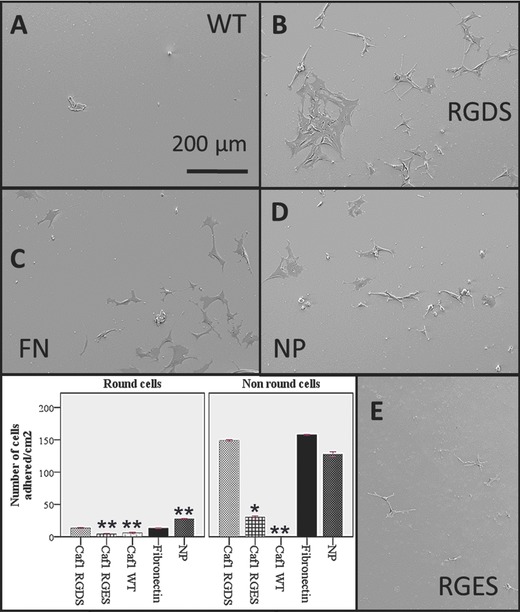
Figure 2.

Fibroblasts on Caf1 polymers. Glass slides were incubated with each of the proteins shown then used to culture mouse 3T3 fibroblasts for 24 h before being finally fixed and imaged by scanning electron microscopy. A) WT Caf1 polymer. B) Loop 5 RGDS Caf1 polymer. C) Fibronectin. D) Buffer treated glass – no protein. E) Control Loop 5 RGES polymer. Histograms show differences in cell morphology. Non‐round cells show one or more filopodia. Data represent the mean of three experiments ± standard error of the mean (S.E.M). Significance was determined by one way ANOVA analysis with Scheffe as a post hoc test was conducted. (*) P < 0.01 compared to fibronectin, (**) P < 0.001 compared to fibronectin.
