Fig. 6.

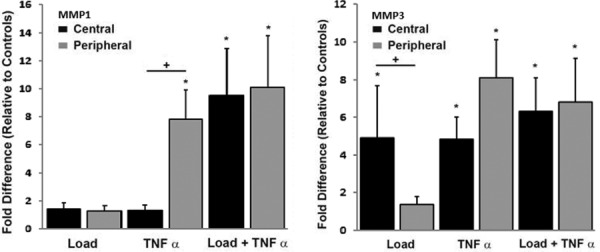
Relative expression of MMP1 (left) and MMP3 (right) stratified by region. * indicates significant difference from free-swelling controls, + indicates significant regional differences in the upregulation of mRNA.

Relative expression of MMP1 (left) and MMP3 (right) stratified by region. * indicates significant difference from free-swelling controls, + indicates significant regional differences in the upregulation of mRNA.