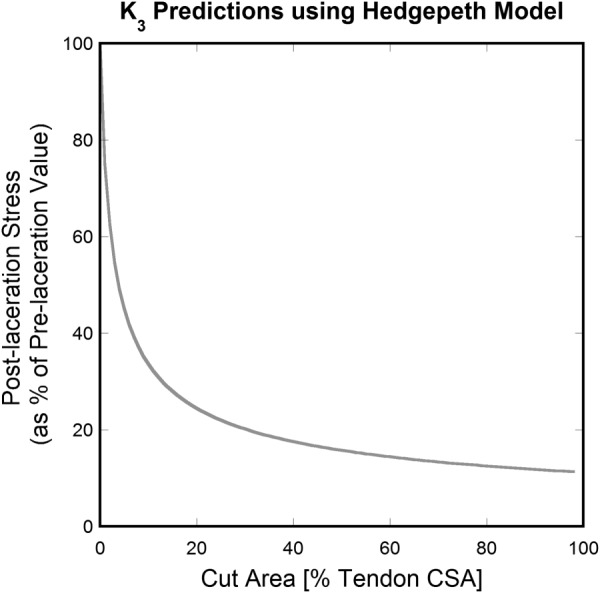
Fig. 2.

K 3 predictions versus (percent cut fibers for the 100 fiber case) according to the Hedgepeth model. An asymptotic shape is obtained. Note that values of depend directly on the absolute number of cut fibers in the material rather than on the percent of cut fibers.
