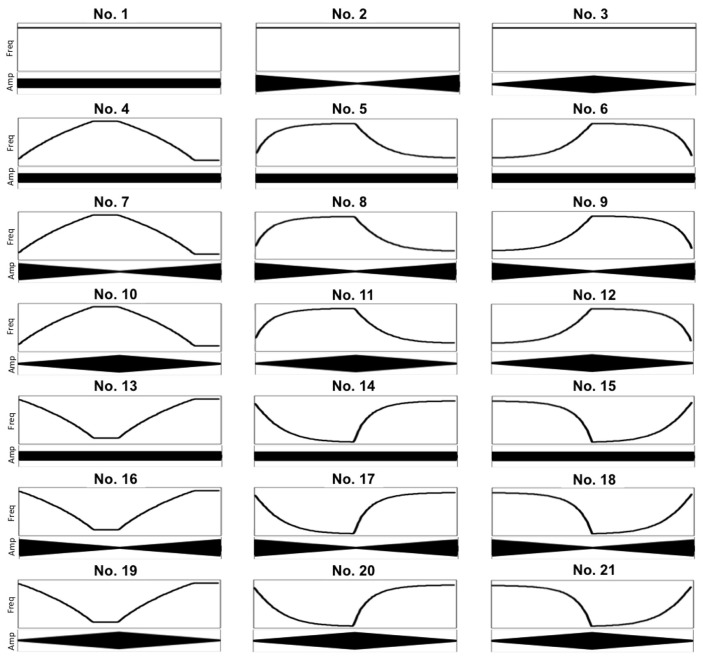
Figure 1.
Overview of frequency and amplitude contours of experimental sound stimuli. All x-axes represent time (length of stimuli: 8 s). Highest/lowest frequency: 123.47/293.67 Hz. Equal amplitude means 50% of the maximum, decreasing amplitude means 90–10% of the maximum and increasing amplitude means 10–90% of the maximum. Freq, log frequency (Hz); Amp, amplitude.

