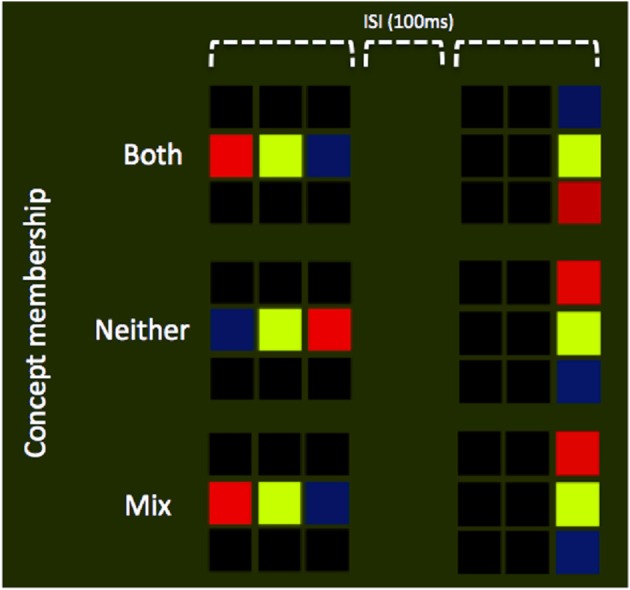
Figure 2.

Experimental design. Schematic illustration of display sequences, in which all trials consisted of two stimulus presentations each with a duration of 1 s. Separating these two presentations was a blank screen, ISI interval of 100 ms. Participants were instructed to respond on the basis of the number of patterns that matched the target concept. Three possible combinations are illustrated in the panel above: (1) Both stimuli are drawn form the target concept set (top row; see Figure 1, for the rules on concept membership), (2) Neither stimuli are drawn from the target concept set (middle row), or (3) a single stimulus is drawn form the target concept set (bottom row).
