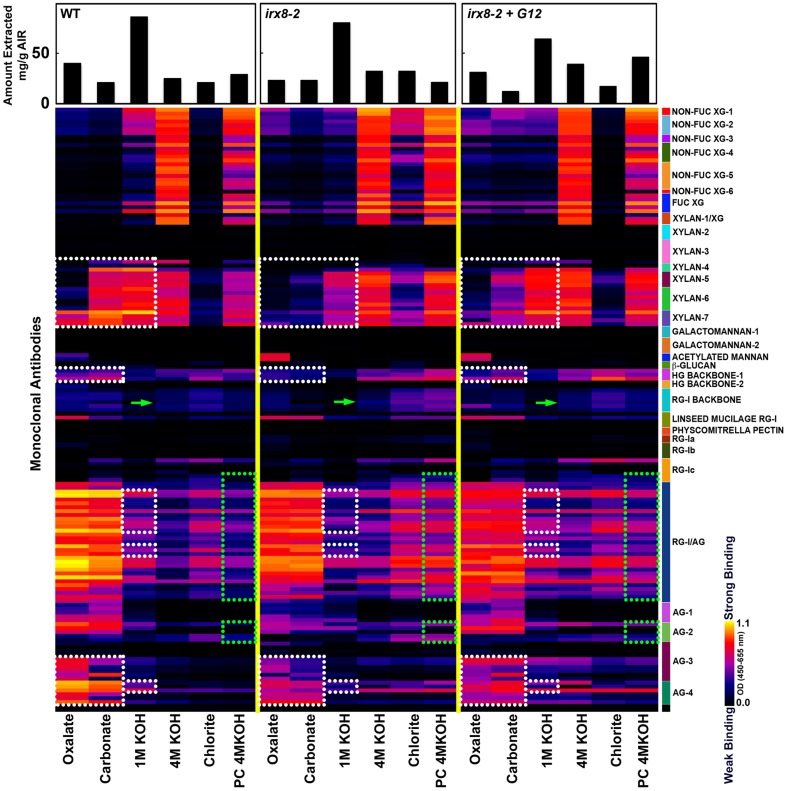
Figure 7.
Glycome profiling of cell walls prepared from 7/8-week-old stem tissues of irx8-2, irx8-2+GAUT12, and wild-type (WT) plants. Sequential cell wall extracts were made from respective cell wall preparations using ammonium oxalate (oxalate), sodium carbonate, potassium hydroxide (1 M and 4 M KOH), acidified chlorite and potassium hydroxide post chlorite (PC4MKOH). The resulting extracts were screened by ELISA using a suite of 155 monoclonal antibodies (mAbs) directed against diverse epitopes present on major plant cell wall glycans (See Supplemental Table S2). The ELISA binding responses are represented as heatmaps with white-red-black scale indicating the signal strength of ELISA (white, red, and dark-blue colors depict strong, medium, and no binding, respectively). The mAbs are grouped based on their specificity for cell wall glycans as shown in the panel at right hand side of the figure. The actual amount of material extracted with each extraction reagent is depicted in bar graphs at the top of the heatmaps. Glycan epitopes with reduced signals in irx8 are outlined with white dotted blocks, while those with increased signals in irx8 are outlined with green dotted blocks. Green arrows point to CCRC-M14 labeling.

