
Figure 3.
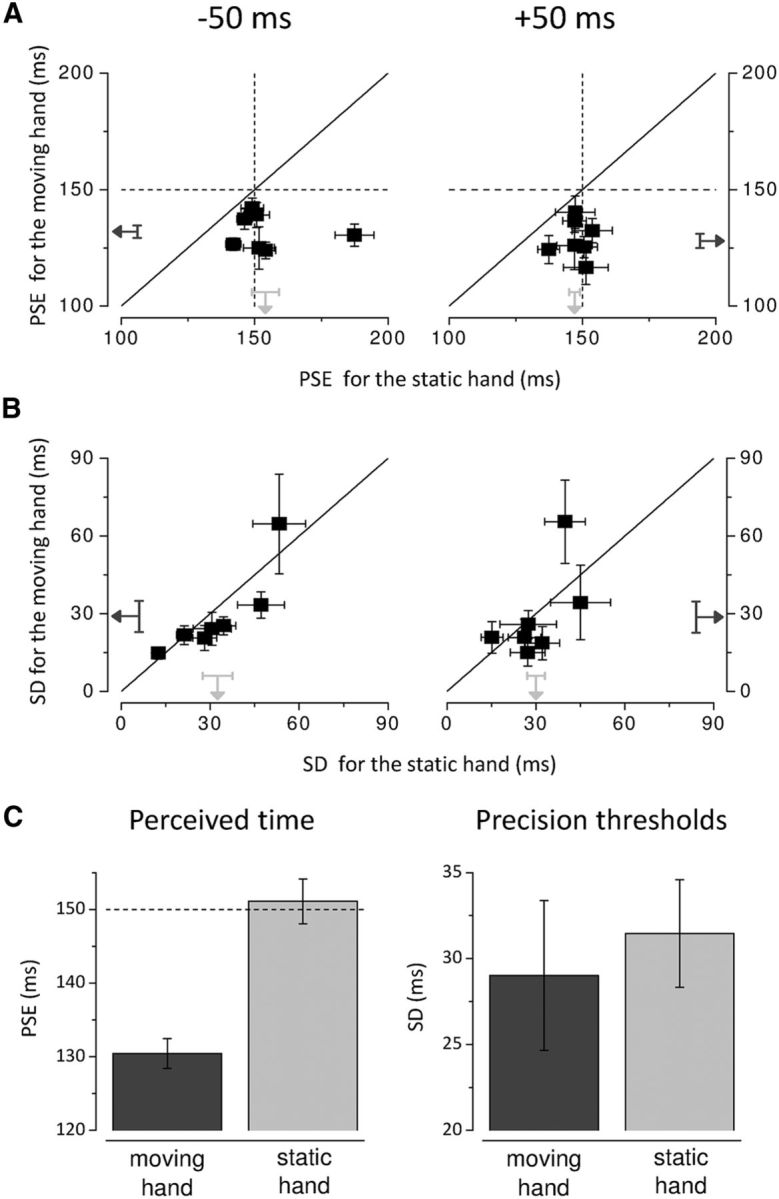
Individual PSEs (A) and SDs (B) for stimuli delivered to the right hand are plotted against those for stimuli delivered to the left hand when the center of the test interval fell within 100 ms before movement onset (latency −50 ms; left) and 100 ms after movement onset (latency +50 ms; right). The diagonals show equal perceived time (A) and precision in temporal judgments (B) for the two hands. The vertical and horizontal dashed lines (A) indicate physical durations. The black and light gray arrows show the means for the right and left hand, respectively; results for all subjects. Error bars represent SEM. C, Average PSEs (left) and SDs (right) for the moving and stationary hand over stimulus latencies comprised between −100 and +100 ms. The horizontal dashed line (left) indicates physical test duration. Error bars represent SEM.